
Accumulation Zone and Distribution Zone – There Are Doubts (using DOT as an example)
We are all looking for some benchmarks in the market, hints and patterns that will bring us closer to understanding the current market. And sometimes we cling not to something objective, but to a beautiful story and a pleasant narrative that seems to explain to us how the market functions.
One such model is accumulation and distribution, which is constantly and frequently used by many crypto analysts, bloggers, course leaders, and influencers. The concept itself has its place and can indeed explain something. But the key here is “explain,” not build a forecast or probabilistic model that will help make effective decisions.
The essence of the accumulation zone
The market operates on the same scheme: large funds invest money in projects at an early stage, then pump the project, and then sell if possible (since many investors who entered at an early stage have vesting and cannot sell their tokens).
And then the token price drops for an indefinite period and starts a slower decline with occasional upward spikes, and this is called the accumulation zone.
Then, after a few months, when the price falls another 20-50%, the accumulation zone will be referred to as this new zone, not the previous one. =)
“This is the accumulation zone for large players; they are buying here.”
Then the token drops another 20-30%, and the accumulation zone is now here.
When asked how long this accumulation process can continue and where the end of the decline is, where the beginning and end of the accumulation zone are, the answer is often: “Large funds will eventually pump the asset by 10x-50x, so it doesn’t matter whether you buy now or 50% lower.”
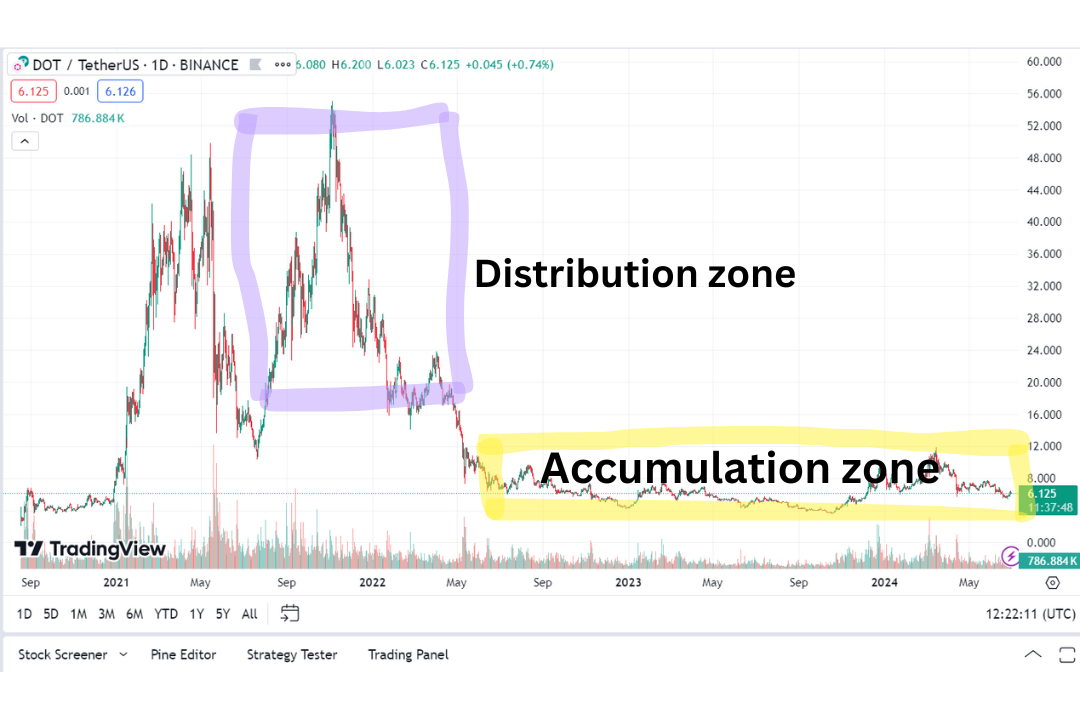
Take Polkadot.
The price has fallen 73% from the maximum. If the price returns to the maximum, there will be a 230% increase. Six months have already passed since reaching the maximum. If someone you follow/read has been doing analysis or blogging since 2022, many would have noted a significant market pullback and the formation of an “accumulation zone.”
But what do we see next? The price drops another ❗️ 80%. Quite the accumulation zone. Show me those Smart Money buyers who see an 80% drop and say, “It’s dubious, but ok.” This is not smart money; these are only the small investors investing based on DCA (Dollar-Cost Averaging). They might indeed say that, finding themselves at the level of $12 average purchase price (by the way, DOT won’t reach these prices even in 2024).
Distribution zone
And now look at the chart up to our days. Ask yourself: if funds and smart money were accumulating the asset, then perhaps when BTC doubles, and many alts show significant growth, such a large accumulation zone would lead to a pump and a distribution zone?
And this 90% jump, if counted from the middle of the accumulation zone, was the creation of the distribution zone =)) But where are the multiples?
What’s next?
If prices rocket above $20, they will say it was also part of the accumulation zone. If the price drops to $1, down 11 times from the prices reached in 2024, this zone will be called the “distribution zone,” where “smart money was selling assets to hamsters.”
This is how all these seemingly deep reflections on how the market, smart money, accumulation, and distribution zones work are built. The truth is that every day the DOT token supply increases by ~0.01% from the max supply, and for several years the market has been unable to digest this.