DXY and Financial Market Analysis for the Week (10.06)
Understanding the intricate movements of major financial indices and assets is crucial for traders and investors. This week’s analysis covers the Dollar Index (DXY), Bitcoin to Tether (BTC/USDT), S&P500, West Texas Intermediate (WTI) crude oil, and major currency pairs like EUR/USD and ETH/USD. We delve into last week’s performance and provide a forward-looking perspective for the week ending on 10.06, highlighting critical price ranges, market fundamentals, and potential scenarios.
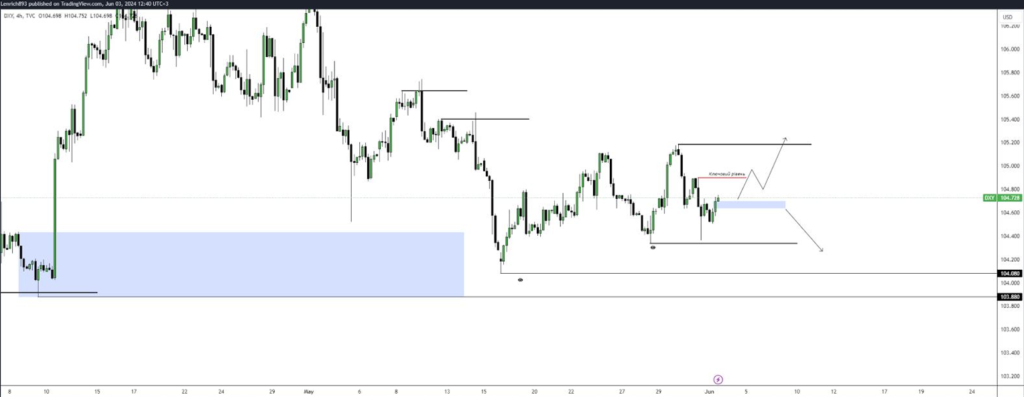
DXY Analysis
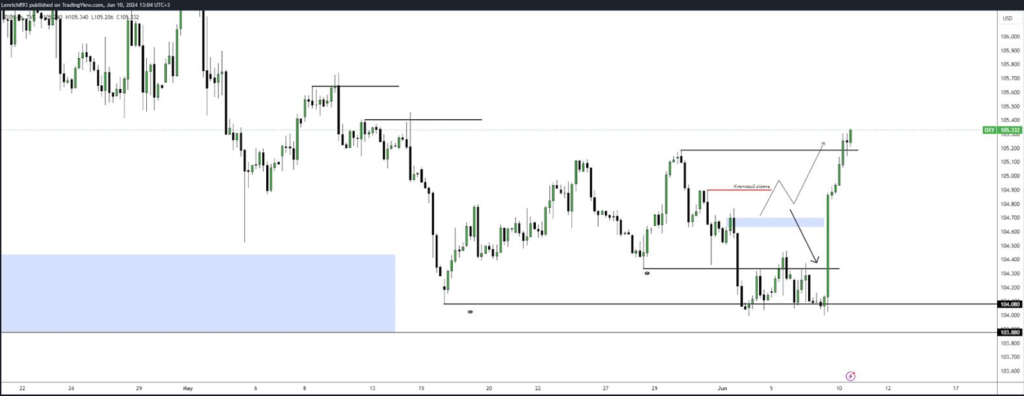
According to the analysis last week, we see that there has been a full work of short narrative in the range 104.3 – 104.
It is worth noting the release of fundamentally positive news for the dollar on Friday, which delivered the price in the range 105.1
With the agreement of the formation of imbalance and fixing the price, over the range 104.9 will be long. In this scenario we will consider the price movement in the range 105.200
Alternatively, if these conditions are not met, we will adhere to the short narrative. The targets in such a price case range 104.3 – 104.
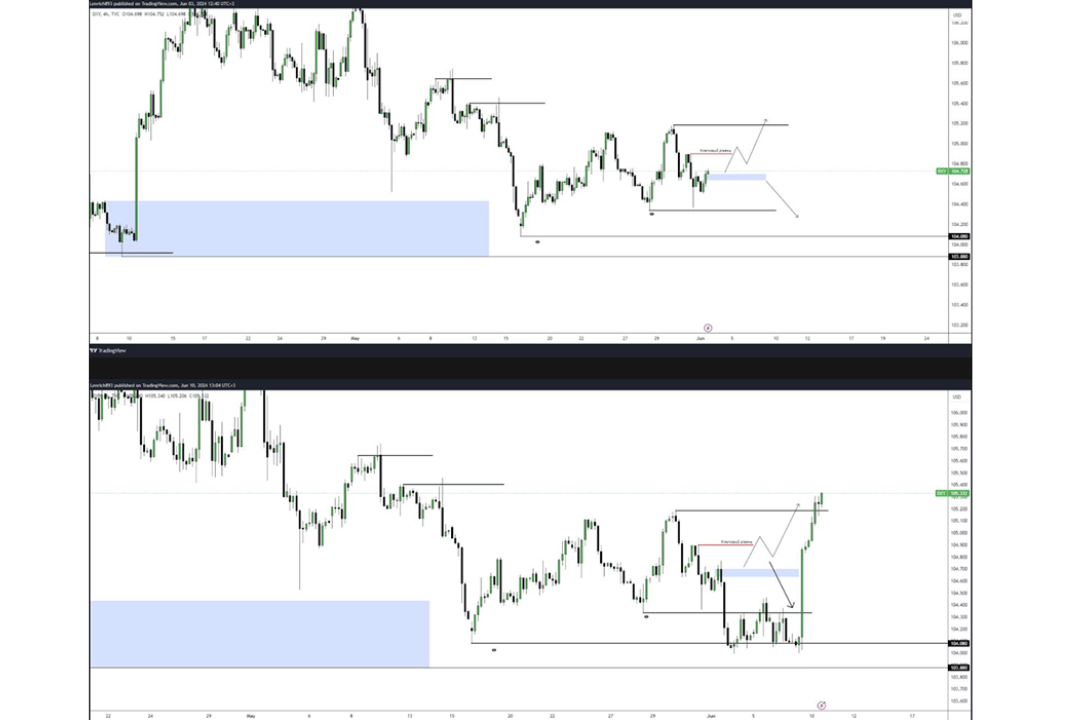
Actual analytics(10.06)
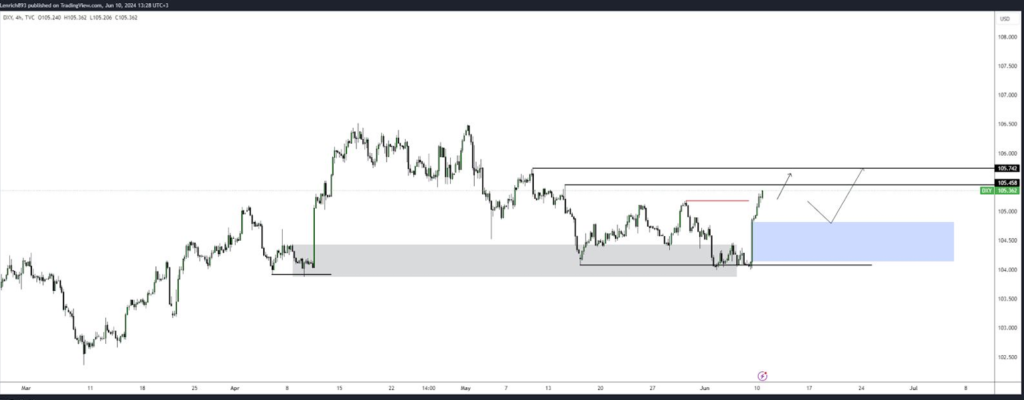
Given the four-hour breakdown of the structure, this week on the dollar index we will set a long story.
It is worth considering the price movement in the range 104.45 – 105.74 due to a possible imbalance test marked below.
What it will affect
If the dollar’s strength increases and the index rises – the currency markets are bad, and vice versa, if the index decreases – fiat currencies feel better.
Often, but not always, the growth of the dollar index coincides with the weakness in other assets.
DXY Fundamental
According to labour market data, market participants expect a maximum of one Fed rate reduction of 0.25% this year. Previously, it was expected that the Fed would lower the interest rate to 4% in 2024. That is, it is expected that the bet will be kept high for a long time.
Most interestingly, this is happening just as the central banks of Canada and the EU began to lower their interest rates and the likelihood of a Fed rate reduction at the forthcoming meetings increased.
Key events this week:
- Wednesday (12.06)
- USA — CPI Consumer Price Index — 15:30
- USA — Crude Oil Reserves — 17:30
- USA — Fed Rate Decision — 21:00
- USA — Fed Press Conference (Powell Speech) — 21:30
- Thursday (13.06)
- USA — Primary Applications for Unemployment — 15:30
- USA — Producer Price Index (PPI) — 15:30
BTC/USDT
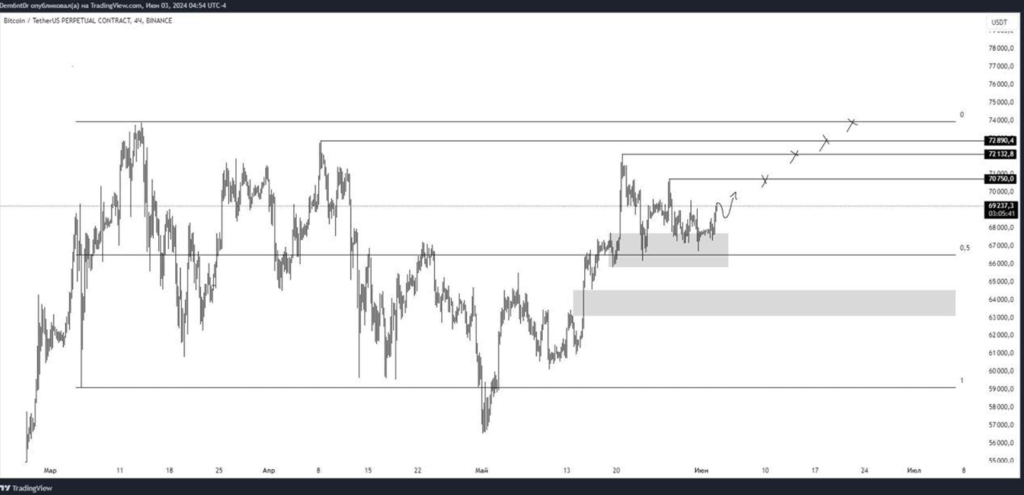
Analysis of last week (03.06)
According to analysts the price took the first two targets, reproducing the movement in 5.25%
Current BTC/USDT analytics (10.06)
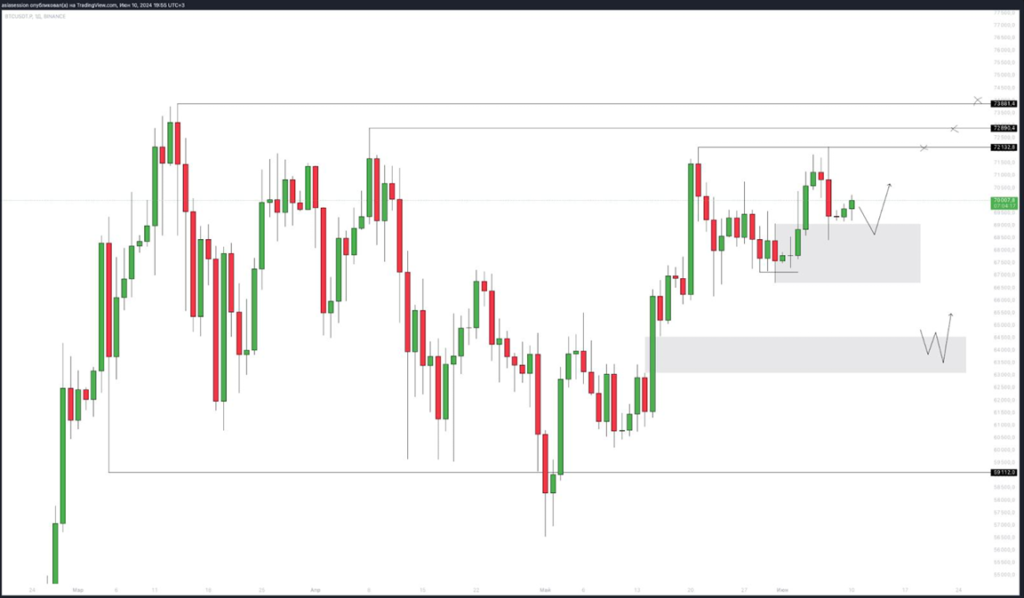
1W
Last week, the price was able to solidify over the past ATH, which is a bullying factor.
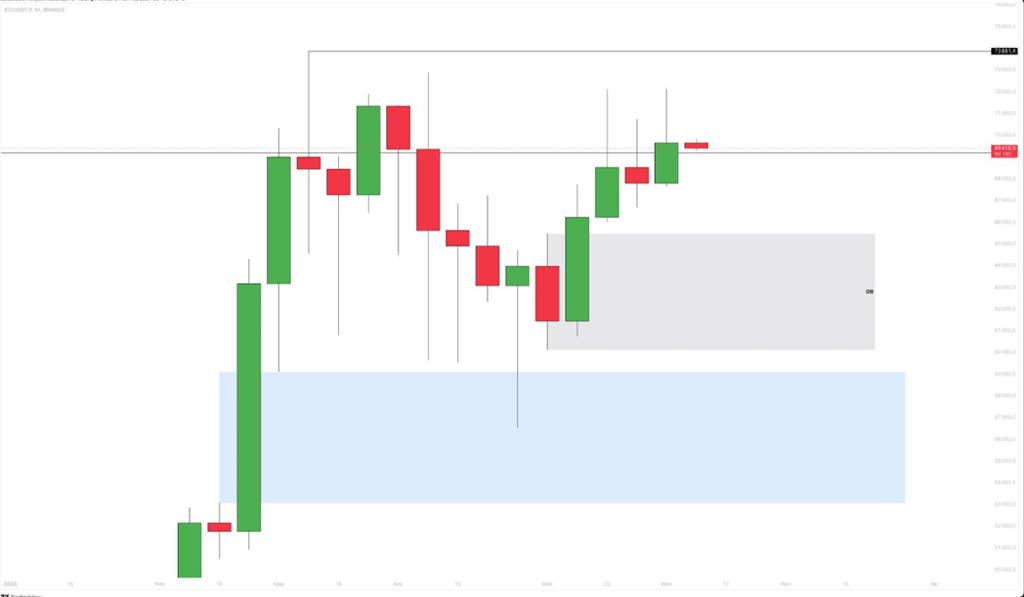
1D
Locally, the price has stopped in side movement, forming an order block, which was tested on Friday and from which the price can replicate movement already up to 74,000.
However, we still have an extreme option, if the price fails the day order block, it will lead to the test of the day imbalance, where again it is interesting to look for long positions.
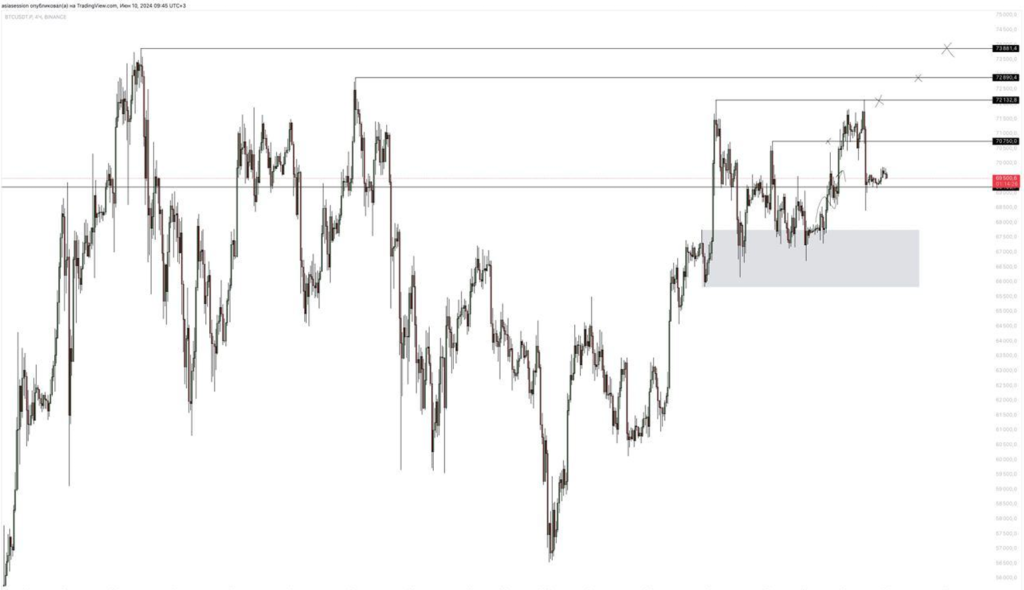
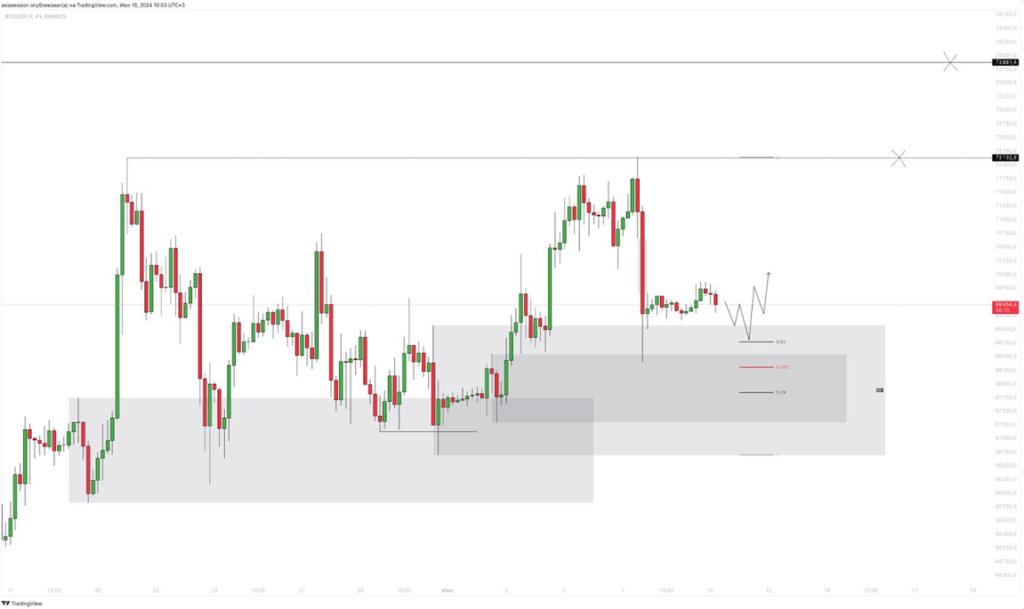
4H
It is possible to specify the zone to a more local, in which to expect the price, however, the area has already been tested, so it is possible movement up immediately from the local side.
S&P500
Analysis of last week (03.06)
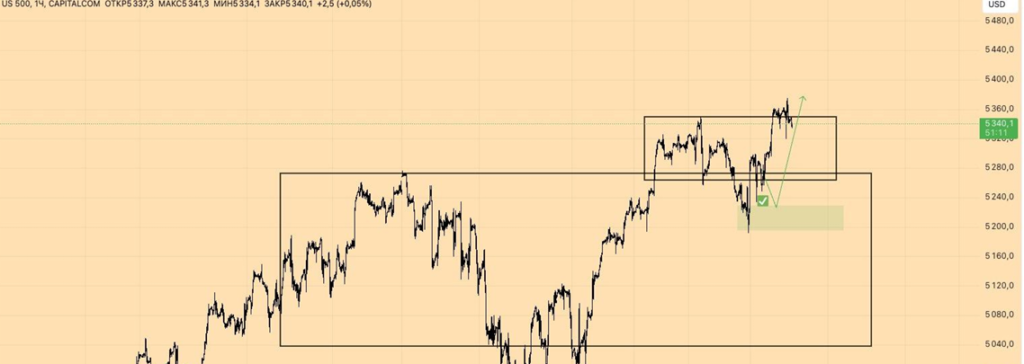
From the past US500 analysts we see that the long-running scenario worked out.
After keeping the designated zone, the same who stood in the longs congratulate with the profit!
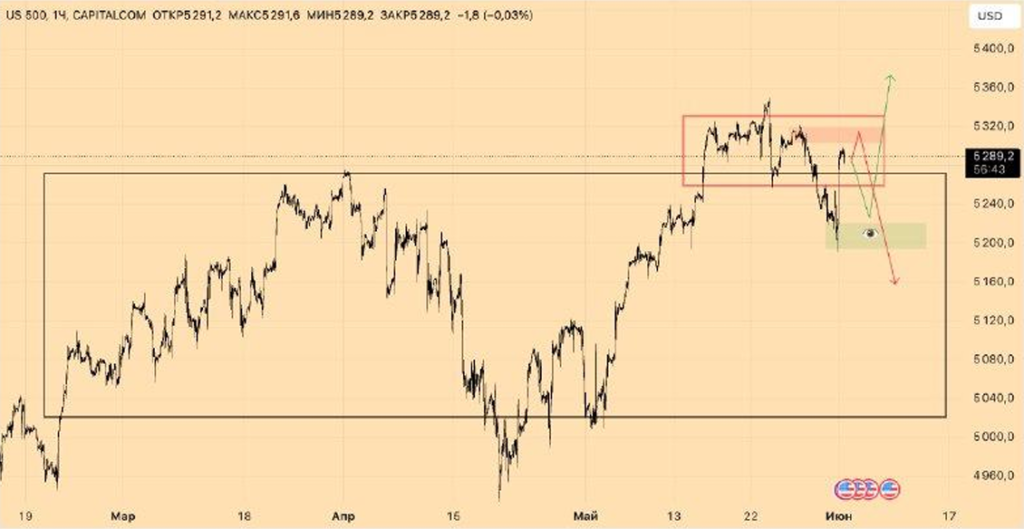
Current S&P500 Analytics (10.06)
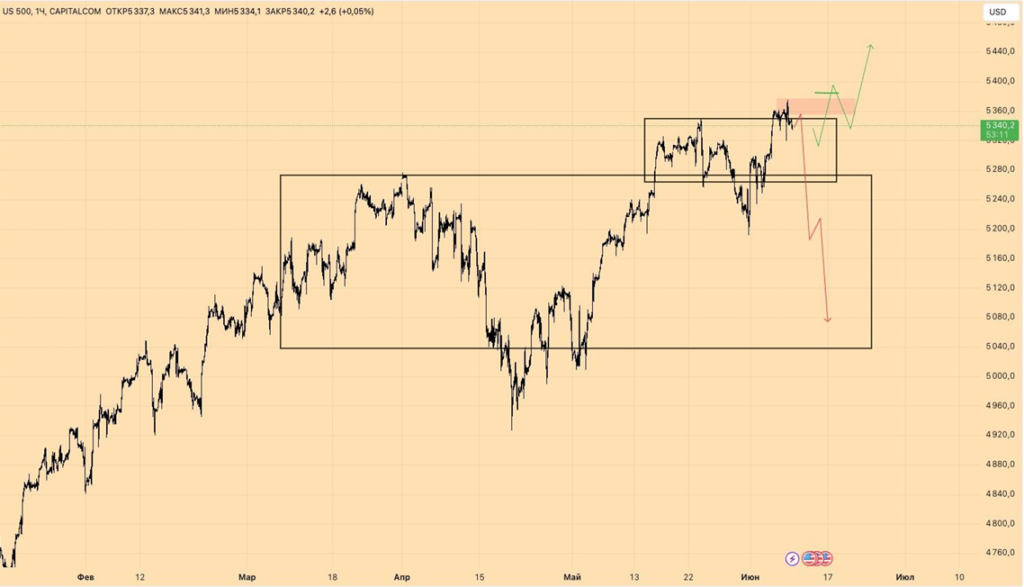
In the case of the sitation on SPX is double. On the one hand, the trend is developing and we need to move on it, and on the other, we have a confirmed turning zone.
If in the next few days the shorts will hold 5360, then we can expect a deep dive at 5200-5000.
We are not in a hurry to open the longs, we will do this only after they give back, i.e. they beat the current short zone 5260.
S&P500 Fundamental
S&P500 Fundamental Last week a lot of important economic indicators were published. And they all point to the growing US economy, so there is a long-term positive for stocks and crypto.
Low primary unemployment requests and employee rates indicate a strong labor market, which in turn indicates a low likelihood of a recession.
Growth in stocks and sales from wholesalers = high consumer demand = strong economy.
WTI
Analysis of last week (03.06)
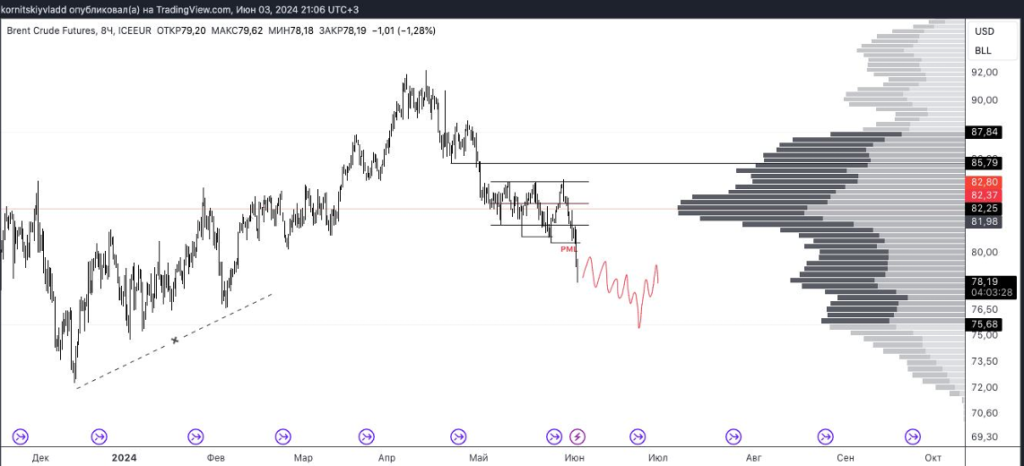
So last week, oil went into a breakdown and received a sharp decline and has already managed to reach the support zone, which are currently trying to play out.
Current WTI Analytics (10.06)
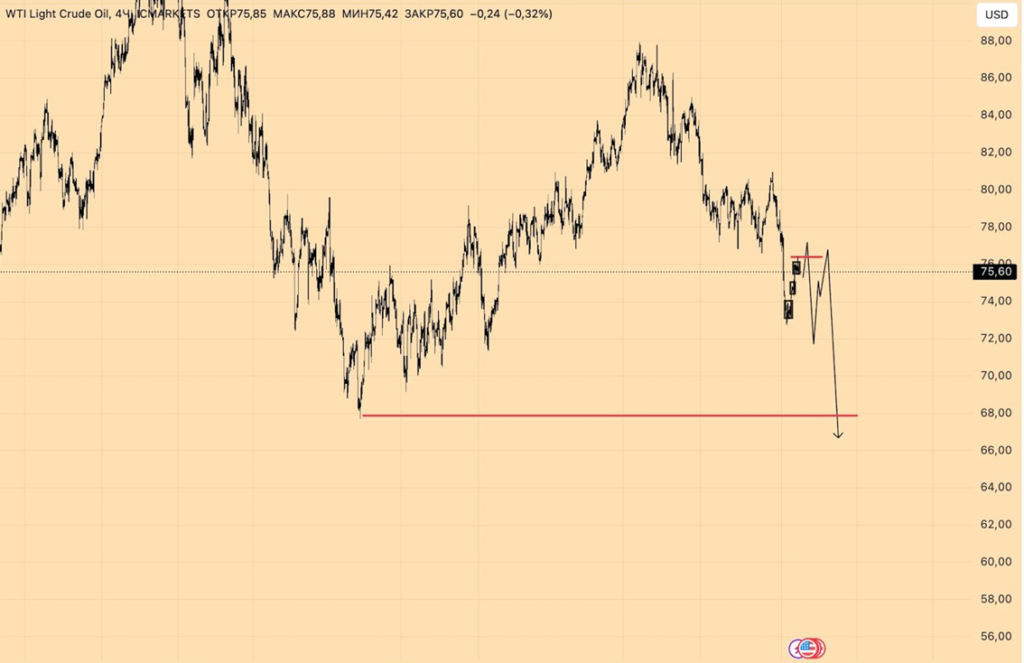
For the further trend down, you want to see the opposite from the previous zone and the installation of a new side.
The zone of resistance will act past the zone from which there was a breakthrough. So now we need to get a breakdown of the structure of the locally long trend.
WTI Fundamental
The price continues to move towards our long-term target of $68-70$. The reason for this movement was described in previous releases of analysts, last week nothing changed.
Briefly about EUR/USD and ETH/ USDT
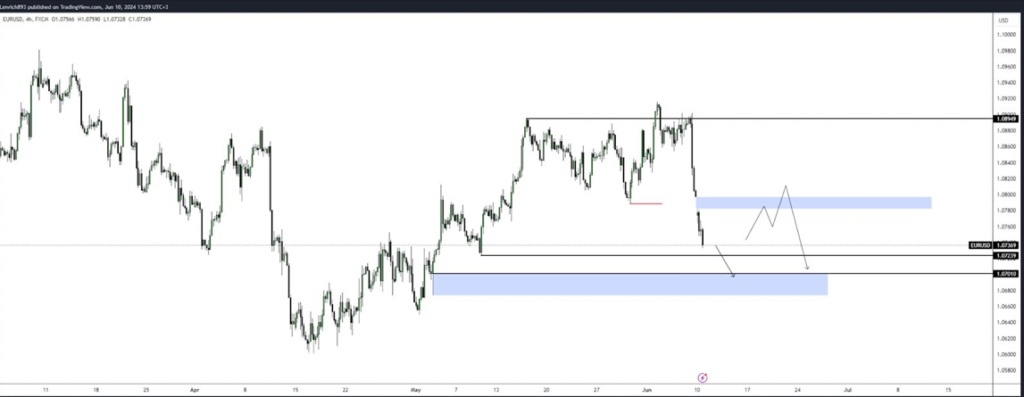
Current EUR/USD Analytics (10.06)
Synchronizing the chart with the DXY, the table for this week on this currency pair looks short. The target in this case is the range 1.07250 – 1.07000.
We also do not rule out a hike to fill the heap up, which acts as a magnet for the price and from where you can expect a short reaction.
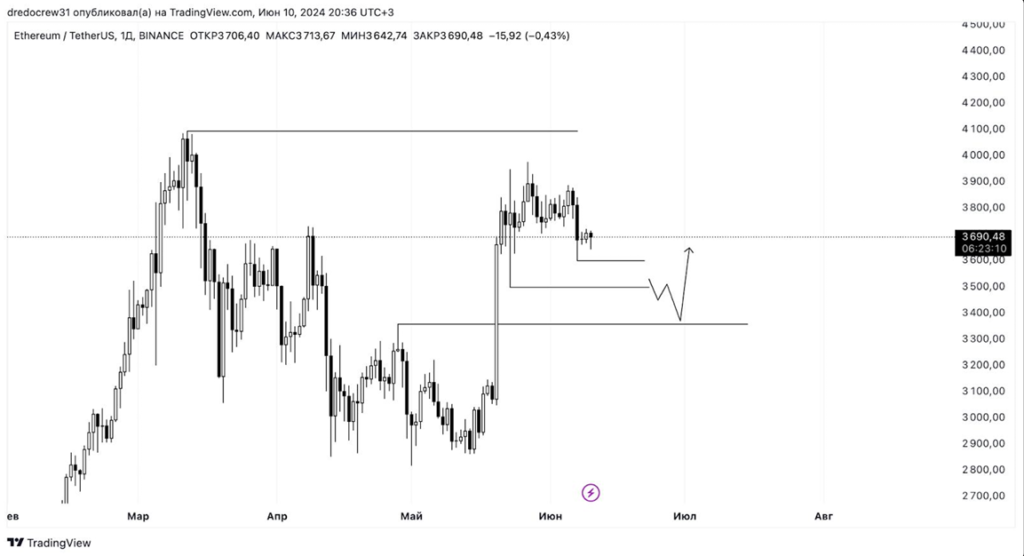
Current ETH/USDT Analytics (10.06)
4H
The price demonstrates obvious weakness, hence it may move towards untested ranges. The key will be to wait for the price to reach the marked FVG and from there get a full move to the previously set targets. The main advantageous zone for considering long positions is anything below the range low. Globally, we are still expecting a long resolution for Ethereum, but considering the ETH to BTC chart, we need to wait for ETH to reach the zone of interest for a long to track the moment when the asset shows signs of strength. Therefore, this might not happen as quickly as we would like, and it is also worth keeping an eye on news related to ETH.